
Use this aquarium water change calculator to chart how a given water parameter will rise or fall over the course of multiple water changes. The calculator can account for the daily rise or fall of a given parameter as well as its presence in the change water itself. Please see the companion aquarium water change article Dilution is the Solution for more information. The article summarizes a tiny subset of the aquarium water change article by Randy Holmes-Farley that appeared in Reef Keeping Magazine.
Water Change Calculator Instructions
Enter the value of the parameter at the time of the first water change.
The first water change will always occur on DAY 1 and any subsequent changes will follow at the specified interval. For example, every seven days.
Use a positive number if the parameter rises daily (phosphate for example) and a negative number if the parameter drops daily (alkalinity for example).
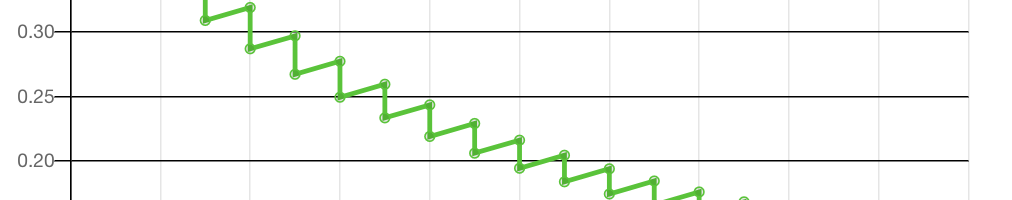
The chart above shows the results of the water change schedule that was entered into the water change calculator. A data point is shown for each for each day, regardless if a water change happened or not. On days where a water change occurs, a data point is recorded before the water change and after the water change. Please see the calculation section below for an explanation of how the chart data is derived and plotted.
Water Change Calculation Formulas
The mathematics for the water change are actually rather simple, When two solutions are mixed together, the concentration of the resulting solutions is found by the following equation.
Where
C1 is the concentration of solution 1
V1 is the volume of solutions 1
C2 is the concentration of solution 2
V2 is the volume of solution 2
NOTE: For the aquarium V2 would be the water change volume and V1 would be the tank volume minus the change volume, as we are not ADDING the change water to the aquarium, but rather we are removing a known volume of water and replacing it with the same volume of water so that the starting and ending tank volume are unchanged. Read this a few times and it will make sense!
So given the above, the actual equation for the aquarium water change dilution would be:
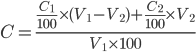
Where
C is the new concentration
C1 is the aquarium’s starting concentration
V1 is the aquarium volume
C2 is the change water concentration
V2 is the change water volume
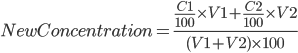
Or written out in longer form, assuming that the volumes are in gallons and the concentration is in Parts Per Million (ppm)

Water Change Charting – the Logic
The aquarium water change equation presented in the previous section is used to build the chart. The water change chart can also account for a daily increase or decrease in the parameter and water changes at fixed intervals of 1 day or more.
The timeline below shows the logic used to chart a water change interval of 1 day (every day) where the substance being tracked accumulates (or is depleted) at a fixed rate every day. Notice that the concentration of the substance is recorded before and after every water change and the water changes occur every day.
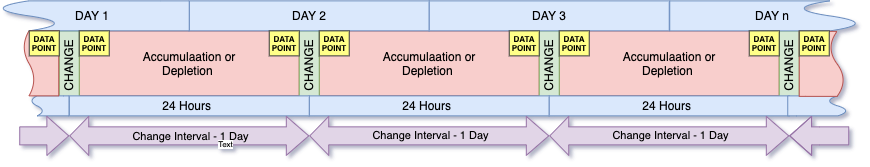
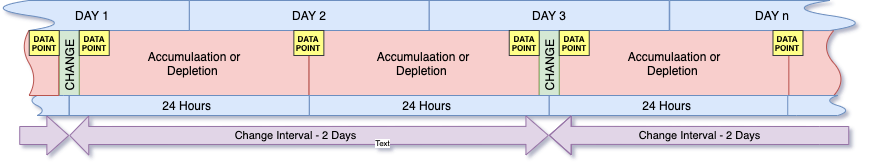
Likewise, if the interval for aquarium water changes is increased to be every other day, the substance being tracked still increases daily. So, on the days with water changes there are 2 data points recorded, the substances concentration before the water change and the substance’s concentration after the water change. On the remaining days, just a single concentration datapoint is recorded. The two day water change interval is shown in the timeline below.
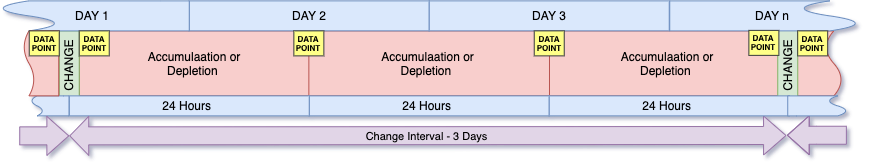
For the sake of clarity, I have included (below) a timeline for a water change interval of every 3rd day. The same logic can be used to understand water change intervals of any length n days.


I dont get it! lol. My alk is now 9.0 but my mix is 11.0. If I remove 8 gallons then my alk should be 9.8! I think lol. Would it be smarter to add some alk to bring my tank to say 9.5 the do water change?
Karen – It depends on the tanks daily usage, size and long term goals. That said, water changes alone are typically not efficient at maintaining major or trace ion levels and dosing is almost always a better choice.
Just asking, why you need to divide with TankGaloon*100 ?
Because we are working in percentages.